


Create WPF dashboard using DevExpress control for business analysis


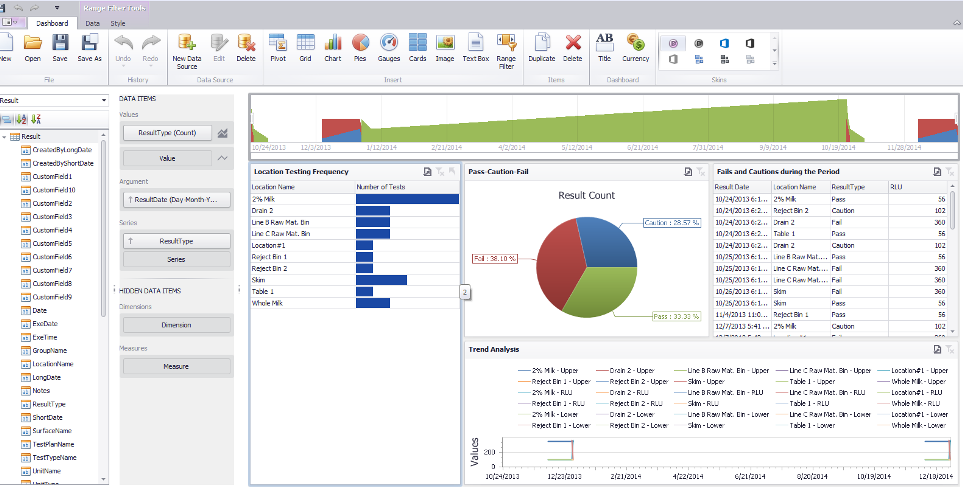
Earlier it was very difficult to design dashboard and it becomes more critical when user ask customization in it. Now we have DevExpress Dashboard control which is really fantastic tool for business analysis. Now user can create flexible, interactive and fully customizable Dashboard which is optimized for real time data consumption and analysis. There are a lot of UI elements such as Chart, Pivot table, Data Card, Gauge, Map or Grid. You just need to drag any item on your screen and supply what you want to see and it provides best data visualization.
It is also available for Tablet.
Wizard for creation of dashboard:
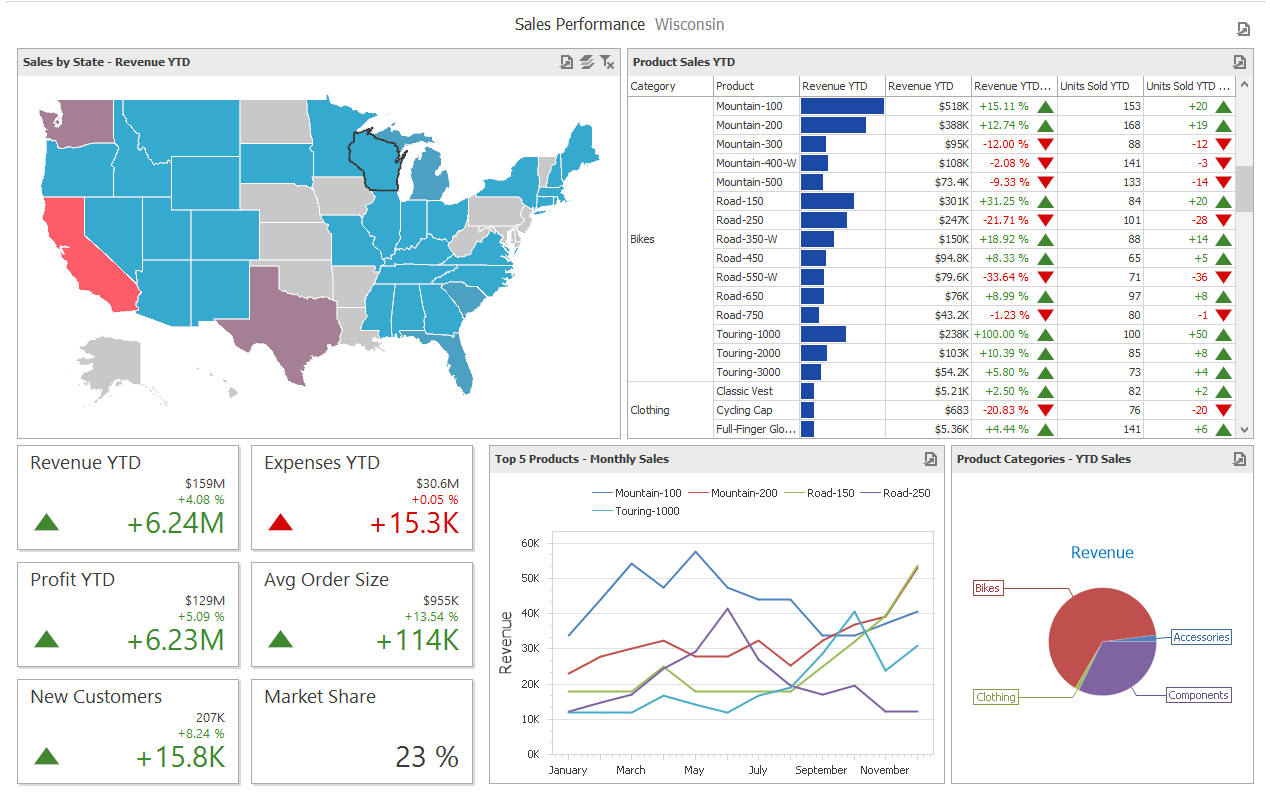
Analysis of Sales performance
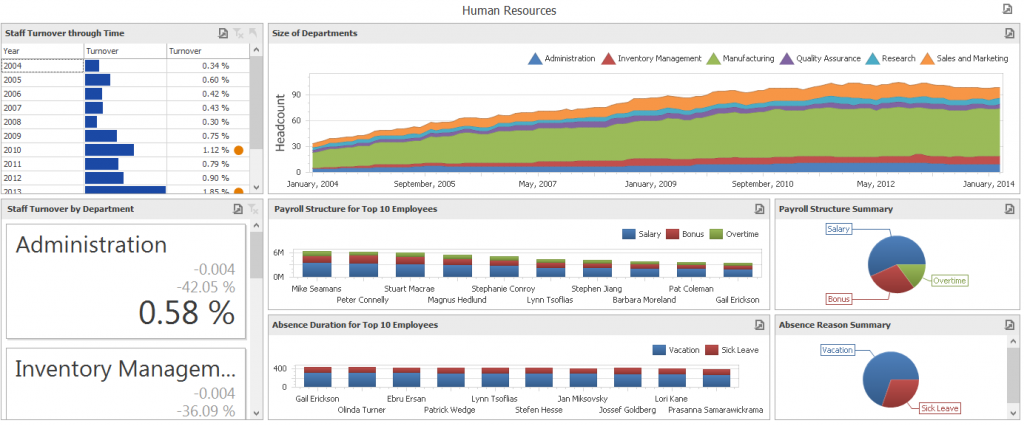
Analysis of Human resource
Posted by-
Sudrashya Sudhir Srivastava
Disclaimer: Developer’s corner section of ISHIR blog is contributed and maintained by independent developers. The content herein is not necessarily validated by ISHIR.
About ISHIR:
ISHIR is a Dallas Fort Worth, Texas based AI-Native System Integrator and Digital Product Innovation Studio. ISHIR serves ambitious businesses across Texas through regional teams in Austin, Houston, and San Antonio, along with presence in Singapore and UAE (Abu Dhabi, Dubai) supported by an offshore delivery center in New Delhi and Noida, India, along with Global Capability Centers (GCC) across Asia including India (New Delhi, NOIDA), Nepal, Pakistan, Philippines, Sri Lanka, Vietnam, and UAE, Eastern Europe including Estonia, Kosovo, Latvia, Lithuania, Montenegro, Romania, and Ukraine, and LATAM including Argentina, Brazil, Chile, Colombia, Costa Rica, Mexico, and Peru.
ISHIR also recently launched Texas Venture Studio that embeds execution expertise and product leadership to help founders navigate early-stage challenges and build solutions that resonate with customers.
Get Started
Fill out the form below and we'll get back to you shortly.