The client is a business management consulting firm helping small to medium sized businesses by providing powerful solutions that are tailored to their business needs. They offer expertise in holistic business analysis, and help to improve performance through organisational structuring, operational efficiencies, and profit engineering.


The Business Challenge
The firm contacted ISHIR to leverage the benefit of sophisticated reporting and analytics capabilities to turn data into insights. The need to address the same was identified by the their leadership, where they felt they are constrained by pockets of disconnected capability spread across their client projects.
Lack of seamless data connection to support the account director dashboards (AD) handling all suites of projects across U.S. resulted in the need to develop database reporting systems. Since your data does not have to look complicated be it any business, finance to commercial activities, data reporting has become an integral step in the business functioning. Simply, stated data has become highly imperative to support organisational decision-making and deliver actionable insights.
Without the consolidatory Dashboard, ADs did not had a direct and immediate visibility to critical information required to effectively manage personnel, client behavior, and/or the operational processes. Revenues were dropped due to the lack of visibility and timely access to accurate data. Additionally, current access to the data requires numerous searches through various tools and platforms, which adds an administrative burden that could not be afforded by the team.
Project Goals
-
Overall System Integration
solution implementation -
Data accuracy
and integrity -
Functional
-
Improve Data
Governance

Our Approach
ISHIR team followed the scrum methodology to rapidly cut multiple level of complexities and comprised the project into different phases. So the first phase was the implementation of Consulting dashboards that has been achieved within the defined timelines. Additionally there are four more phases which will be achieved in future after the successful run of the consultation dashboards.
The Phases were identified by the Dashboard Groups and consisted of Platform Set-up, Integration, Customization, and Automation in each phase to support development and implementation of the individual role-based Dashboards within each Dashboard Group. Each Platform comprising the Firm’s System Integration required Data Table set-up and connection to Tableau. We helped to consolidate the company's reporting and analytics capabilities and reduce the cost of producing reporting and analytics. About half of these savings were achieved by consolidating reports and introducing automation to realise efficiencies.
API's INTEGRATED INTO ANALYTICS PLATFORM

For Project Set-Up and Task Management

For Invoice, Collection, & Time Management

For Accounting

For CRM

For Travel & Expense Management

For Human Resource Management

For Report and Dashboard Development
Final Outcome/ Result
We accomplished all project goals by creating a robust, secure, a database reporting system that streamlines operations, easy to manage, and improves the overall customer experience. The noticeable outcomes are:
- Platforms is connected in such a way to assure data security and complete/accurate data collection within the Data Store/Data Warehouse.
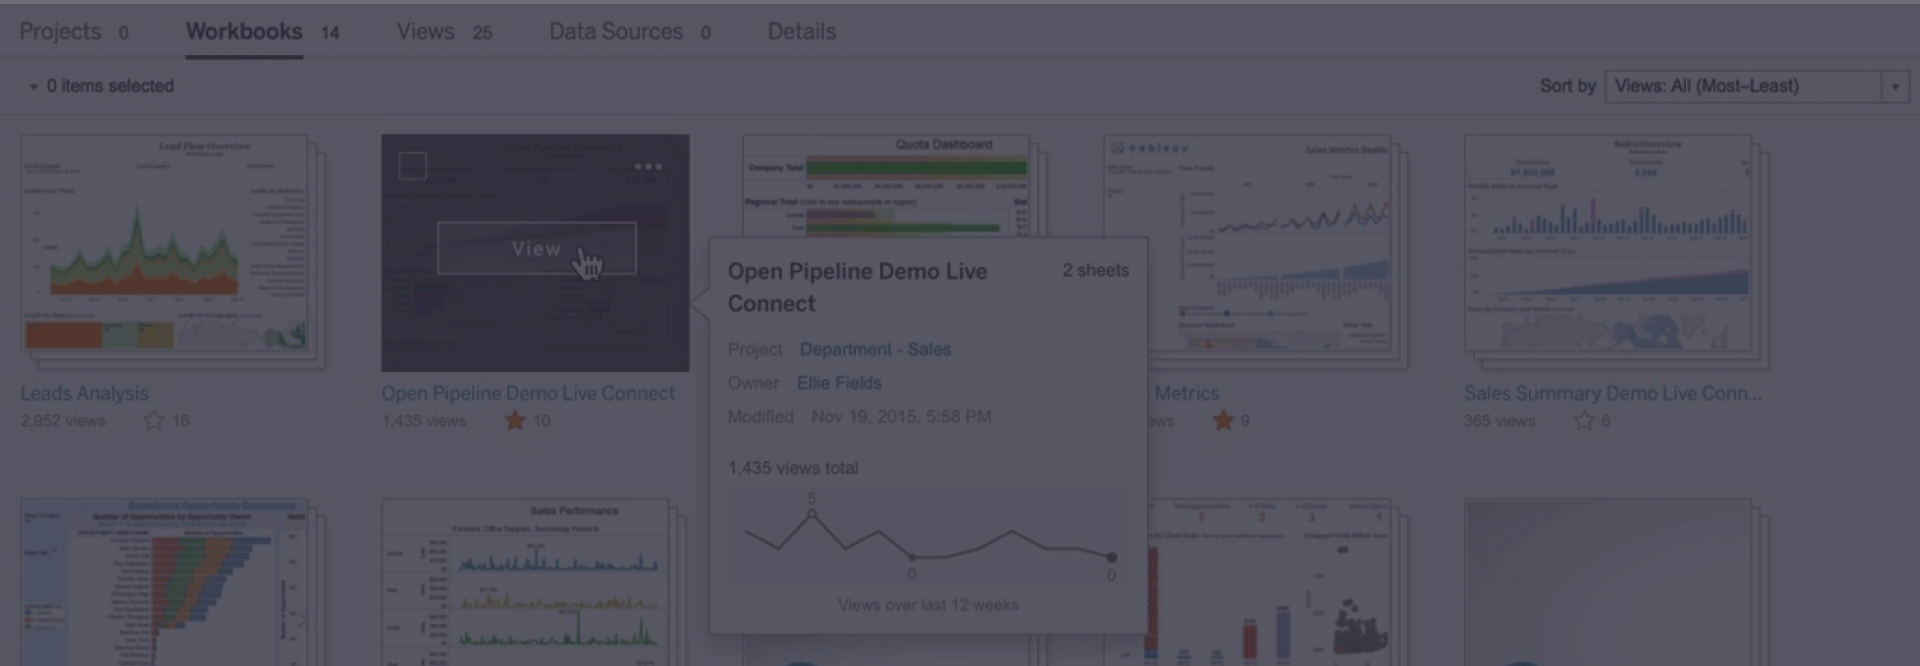
- Automated Dashboards embedded in Core and user access/interaction look like the following way:
- Users should log into Core via Single Sign-On (SSO)
- The users should land on their Dashboard Page upon login to Core.
- Login and access is role-based.
- Users use the Dashboard to drive actions throughout their day.
- Users are able to navigate to connected platforms via links within the Dashboard.
TECHNOLOGIES USED
- As.Net and Angular
- Azure Data Warehouse
- Azure Cloud
- Github for Versioning
- Github for CI/CD Tools


